Sparklines!
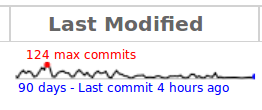
I like neat little tricks that make it easier to take in a wedge of information. Martin Albisetti’s addition to a project branch overview pages is just one of those.
Now, the trunk branch of a project has a visual representation of its activity over the past 90 days. You’ve probably seen similar mini-graphs elsewhere, particularly if you’re a fan of the work of Edward Tufte who names them “sparklines”.
At a glance you get a feel for how many commits the branch has been getting, the distribution of its commits and when its busiest day was during that period.
Take a look at the Bazaar project’s code page for an example, or watch this short video.